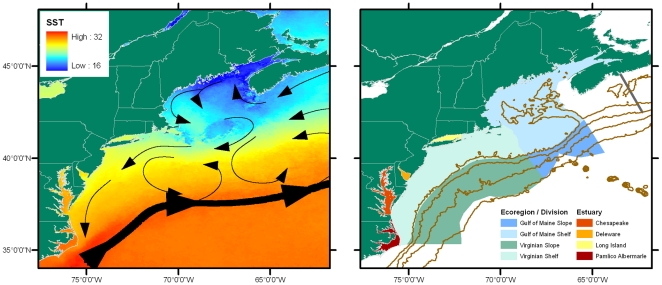
Figure 4. Detail of the study area.
Right panel shows shelf and slope areas used in Table 3. The line extending across the shelf and upper slope (“Halifax Line”) northeast of the Gulf of Maine marks the eastern end of the Gulf of Maine Area Program of the Census of Marine Life. The major bays and estuaries of the Virginian ecoregion are also shown. Left panel shows climatological sea surface temperature for August, 1985-2001 (data are from U.S. NASA Pathfinder mission, 4 km resolution). Arrows show schematic of the prevailing residual circulation (after Townsend et al. [22]).

