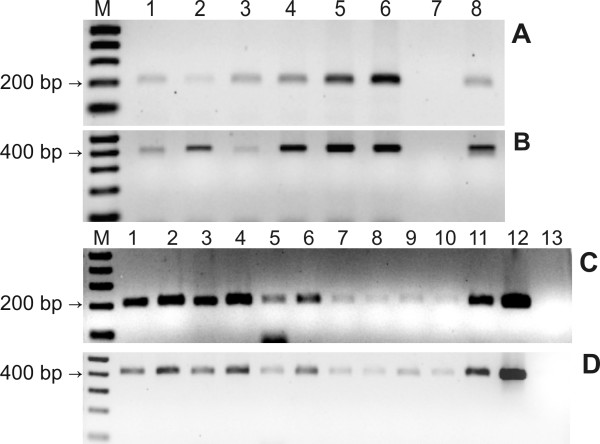
Figure 3.
PCRs of positive C. arabica plants, showing nptII and α-AI1 amplifications PCRs from T0 (A and B) and T1 plants (C and D). A, 204-bp band from the α-AI1 gene of T0 plants. B, 411-bp band from the nptII gene of T0 plants. M, 1 kb plus leader; 1 - 6, T0 transformed coffee plants; 7, non-transgenic coffee plant; 8 positive control (pBIN19α-AI1 vector). C, 204-bp band from the α-AI1 gene of T1 plants. D, 411-bp band from the nptII gene of T1 plants. M, 1 kb plus leader; 1 - 11, positive T1 plants; 12, positive control (pBIN19α-AI1 vector); 13 non-transgenic coffee plant.

