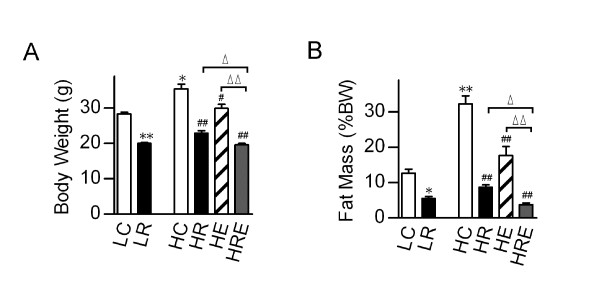
Figure 2.
Metabolic effects of caloric restriction versus voluntary exercise on high-fat diet-induced obesity. (A) Body weight and (B) total body fat mass as percentage of body weight were determined after 8 weeks of intervention. Data are presented as means ± SEM (n = 6/group). Statistical analyses were done with one-way ANOVA. *p < 0.05, **p < 0.01 vs. LC; #p < 0.05, ##p < 0.01 vs. HC; Δp < 0.05, ΔΔp < 0.01 vs. HRE.

