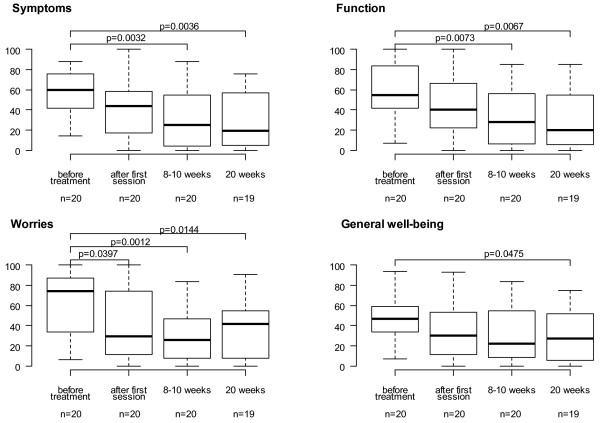
Figure 4.
The levels of subscales of the Short Health Scale (SHS) in boxplots , one box per time point measured. Boxes show interquartile range at each time, median in bold. Differences in median score between time points were tested by the Mann-Whitney test. P-value ≤ 0,05 was considered significant.

