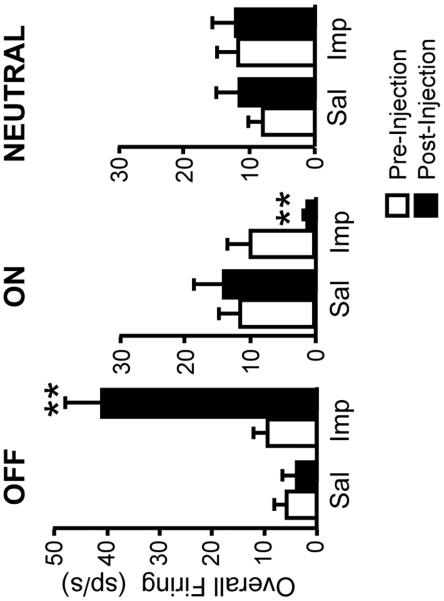
Fig. 4. Overall activity in pre-drug baseline compared with that following injection of saline (Sal) or improgan (Imp).
Post-injection values are average of the three trials in the 5–20 min post-injection interval. **p < 0.01 compared to baseline, Wilcoxon's signed ranks test. (Improgan: 11 OFF-cells, 14 ON-cells, 10 NEUTRAL-cells. Saline: 6 OFF-cells, 7 ON-cells, 4 NEUTRAL-cells).

