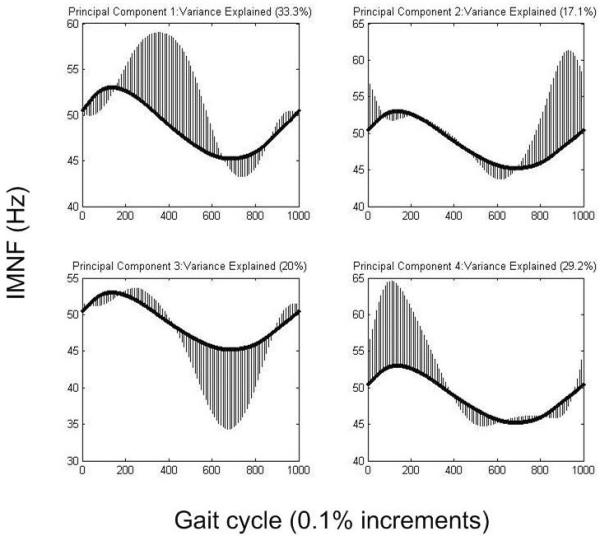
Figure 1.

The principal component output for the gluteus maximus, with 99.6% of the variance explained. The dark curve in each graph is the mean instantaneous mean frequency for all participants, and is the same in each graph. The shaded areas indicate the regions of variability in the entire data set identified by each principal component. Principal components 1, 2, and 4 show the direction of variance for the cerebral palsy (CP) group and principal component 3 shows the direction of variance for the typical developing (TD) group. The group not shown for each principal component demonstrates equal variance in the opposite direction.
