
Figure 8.
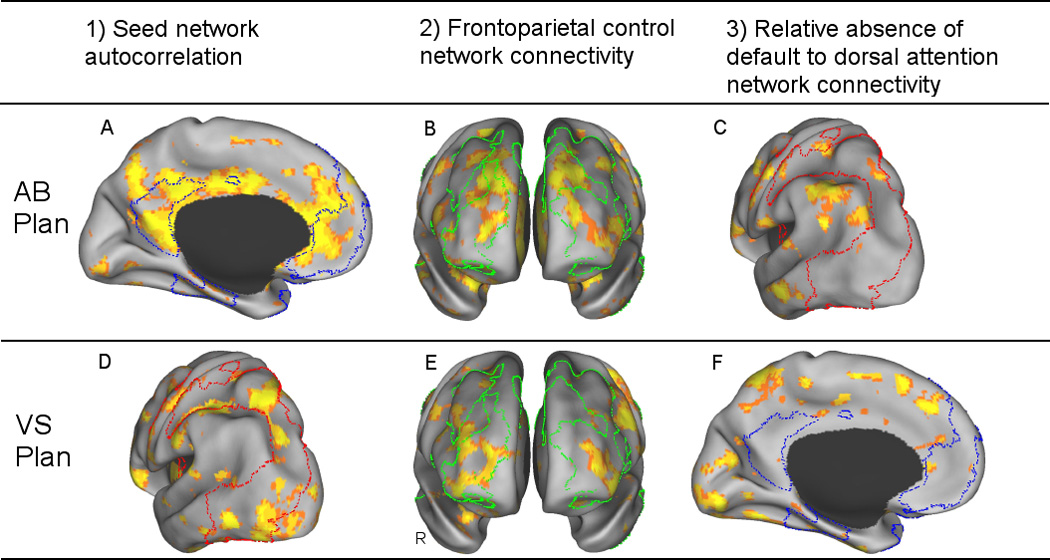
Task-related Functional Connectivity Analysis. Seed PLS results illustrate regions that are functionally connected with the default network ROI BOLD value during autobiographical planning, and with the dorsal attention network ROI BOLD value during visuospatial planning. All three conditions for network coupling were met. During autobiographical planning, network coupling between the default and frontoparietal control networks were demonstrated by A) Default seed network autocorrelations (depicted on the medial surface), B) Default network seed connectivity with the frontoparietal control network (depicted on an anterior view of the prefrontal lobes) and C) a relative absence of connectivity with the dorsal attention network (depicted on a lateral posterior surface). During visuospatial planning, network coupling between the dorsal attention and frontoparietal control networks were demonstrated by D) Dorsal attention seed network autocorrelations (lateral posterior), E) Dorsal attention network seed connectivity with the frontoparietal control network (anterior) and F) a relative absence of connectivity with the default network (medial). Outlined regions are the rsfcMRI maps: Blue = Default network on the medial surface, Red = Dorsal attention network on the lateral posterior surface, Green = Frontoparietal control network on the anterior frontal lobes. Images are thresholded at p < .001 (PLS identifies whole brain patterns of activity in a single analytic step, thus, no correction for multiple comparisons is required). See Supplemental Figure 5 for whole brain results. AB Plan = autobiographical planning; VS Plan = visuospatial planning; R = right; L = left.