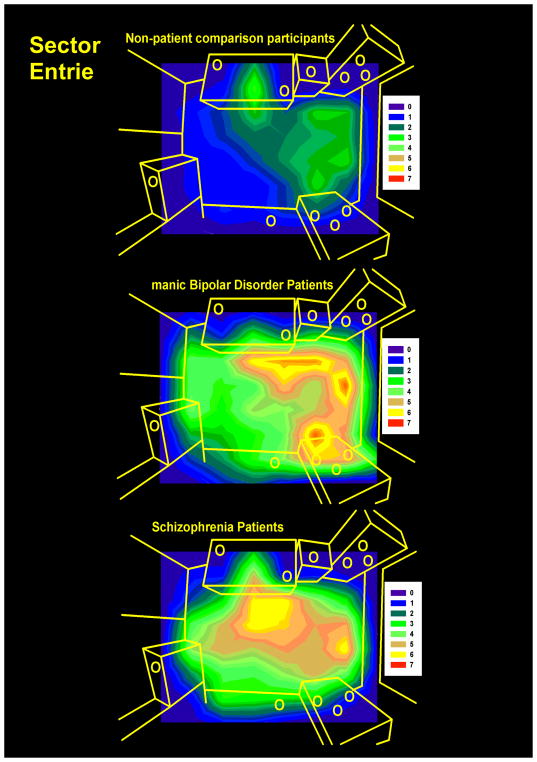
Figure 1. Contour maps of room exploration.
The distribution of average sector entries in each sector in seconds (over a grid of 64 equal size sectors) in the human Behavioral Pattern Monitor (hBPM) is illustrated for non-patient comparison participants (A), manic bipolar (B), and schizophrenia (C) patients. Intensity of activity is denoted by color. 11 objects placed around the room are shown as yellow circles.

