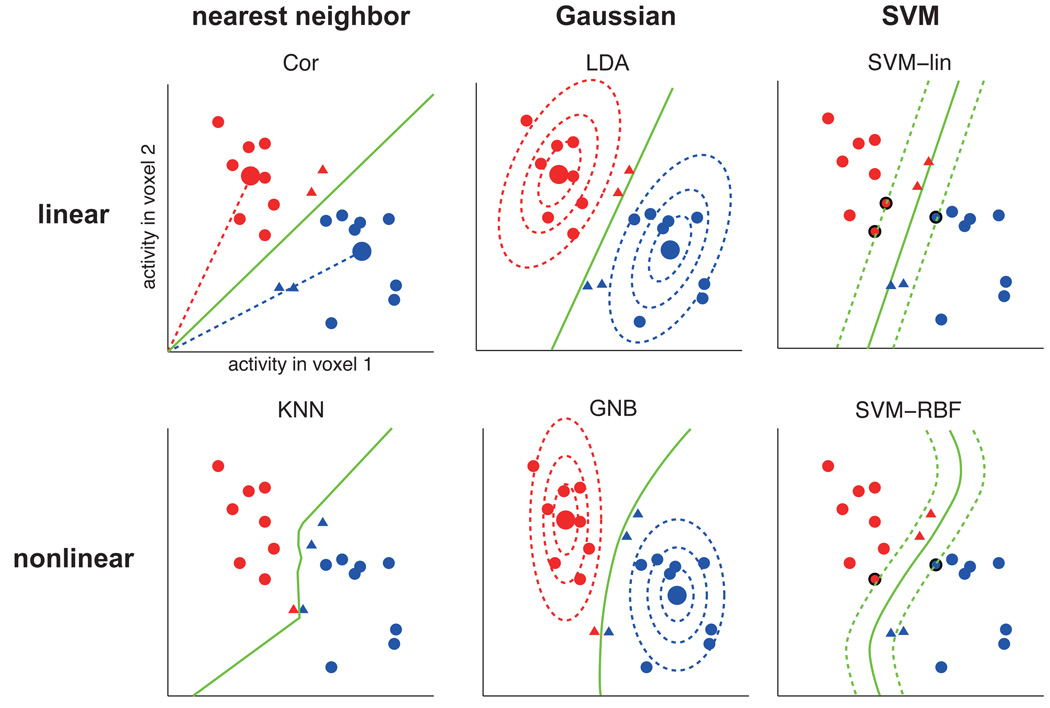
Figure 1. Different pattern classifiers use different decision boundaries.
Hypothetical example of classification by different classifiers. Each classifier determines a different decision boundary on the basis of a set of training patterns (red and blue circles). As a result, test patterns in the ambiguous territory between the two clusters (red and blue triangles) will be classified differently by the different classifiers. The color of the triangles indicates which class it is classified as. The large circles, where present, are the class centroids (i.e. class-average patterns). The dotted ellipsoids (for GNB and LDA) are iso-probability-density contours of the fitted Gaussian distributions. For the SVMs, the dotted lines represent the margin around the decision boundary and the bold-edged circles are the support vectors defining the boundary.

