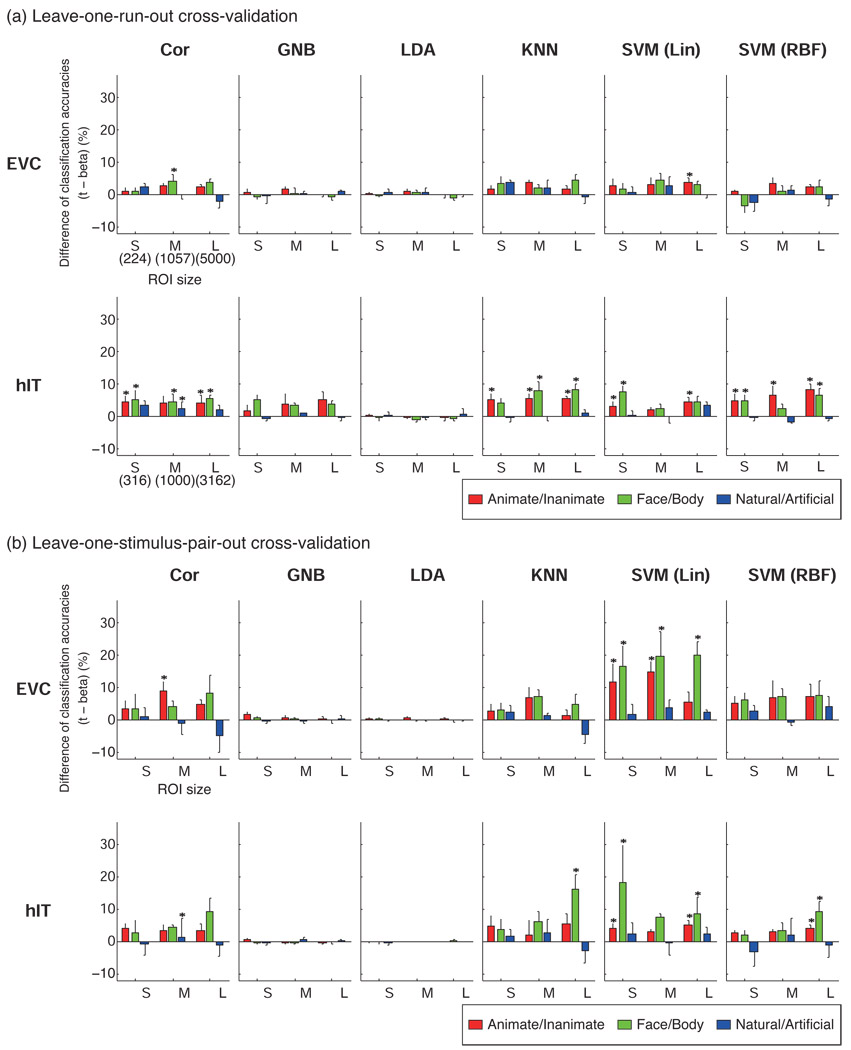
Figure 3. Defining the response patterns by t-values instead of beta estimates yielded better or equal decoding accuracy.
The bars show the difference of classification accuracy between patterns defined by t-values and patterns defined by beta estimates. Positive values (upward bars) mean that t-values gave better classification accuracy than beta estimates. Error bars show the standard error of the mean across subjects. The statistical analysis (paired t test across stimuli) was performed for each subject separately and an asterisk indicates a significant difference (p < 0.05) in at least two of four subjects. S, M, and L indicate the small, middle and large ROI size, respectively. The numbers of voxels in S, M, L were 224, 1057, 5000 for EVC, and 316, 1000, 3162, for hIT. Significant differences were only seen in favor of t-values. LDA and GNB were not significantly affected by the difference of response estimates because they model and thus correct for the variance along each response dimension (see Discussion for details).

