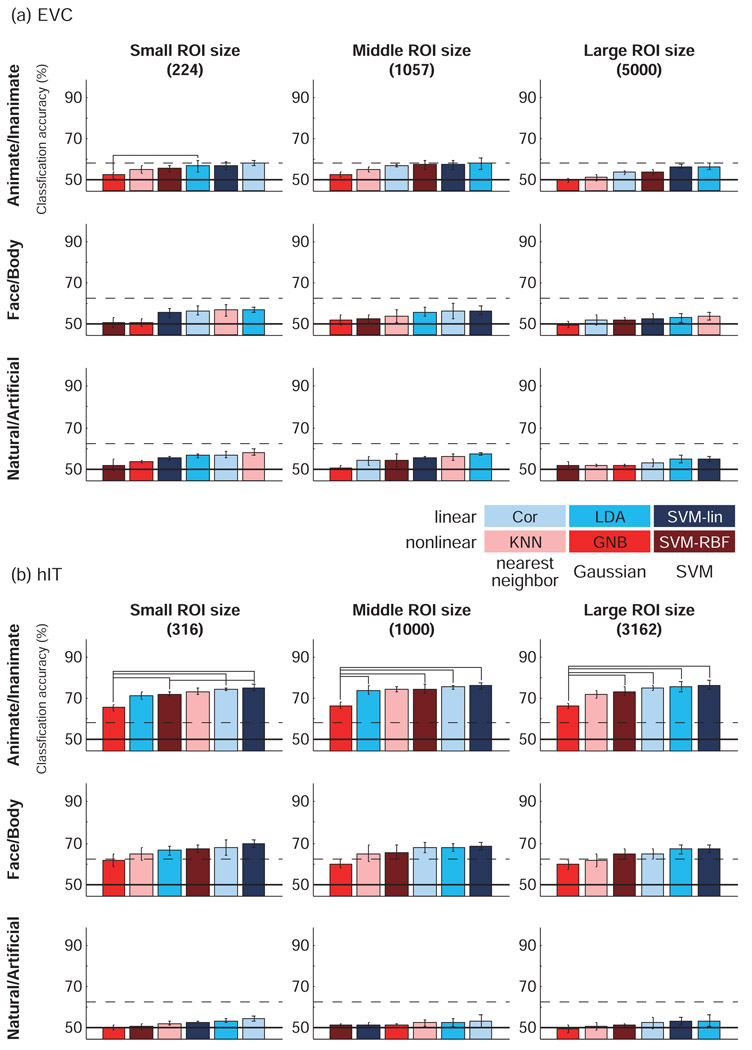
Figure 4. Linear classifiers performed best and not significantly differently (leave-one-run-out cross-validation).
Classification accuracies estimated with leave-one-run-out cross-validation for each classification method for (a) EVC ROI and (b) hIT ROI. The voxels in ROI were selected by visual responsiveness assessed using the average response for the 96 stimuli (t-value) in a separate experiment. Response patterns were defined by t-values. Accuracies are averages across subjects and stimuli. Error bars show the standard error of the mean across subjects. Classifiers were ordered by their mean classification accuracies. Chance-level accuracy was 50% (solid line). The upper dashed line indicates the significance threshold for better-than-chance decoding (indicating the presence of pattern information). For a single-subject accuracy exceeding the significance line, p < 0.05 (not corrected for multiple tests) for a binomial test with 96 trials for Animate/Inanimate, and 48 for Face/Body and Natural/Artificial (H0: chance-level decoding). The horizontal connection lines above the bars indicate significant differences between classifiers (p < 0.05 with Bonferroni correction for the 15 pairwise comparisons of the 6 classifiers) seen in at least two of four subjects (paired t test across stimuli). With this procedure, a horizontal connection indicates a significant difference of decoding accuracy between two classifiers at p<0.036, corrected for the multiple tests across pairs of classifiers, across subjects, and across all scenarios (region, ROI size, category dichotomy, and cross-validation method) of Figs. 4 and 5 combined (see Results for details). LDA and SVM-lin tended to perform best and not significantly differently.

