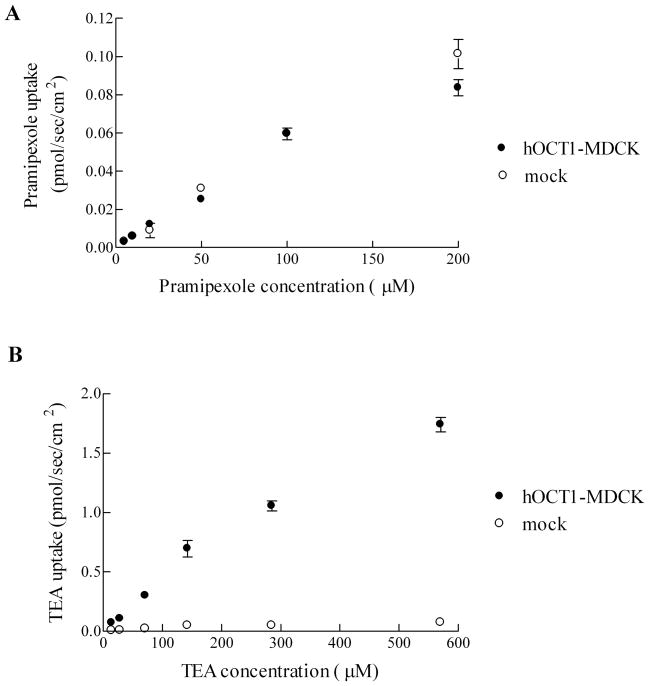
Figure 1.
Uptake of pramipexole and TEA into hOCT1-MDCK and mock cells. A, Pramipexole uptake did not differ between hOCT1-MDCK cells and mock cells over a 5–200 μM pramipexole concentration range. Pramipexole permeability into mock cell monolayers was a low 1.21 (±0.06) ×10−7 cm/sec. B, TEA uptake into hOCT1-MDCK cells was higher than uptake into mock cells over a 14.3–570 μM TEA concentration range. Error bars denote SEM.

