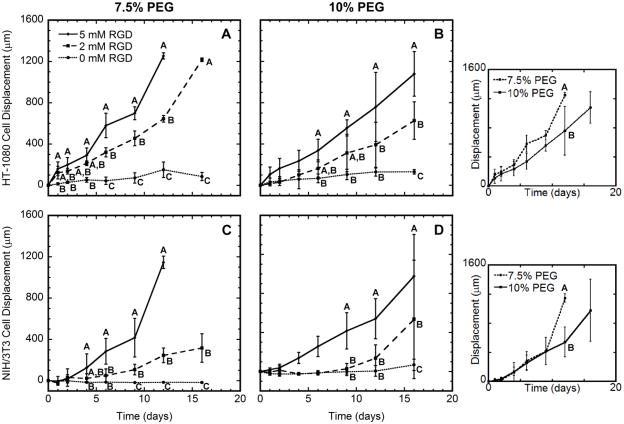
Figure 2.
Cell migration. HT-1080 (A, B) or NIH/3T3 (C, D) cells were encapsulated within PEG hydrogels containing 0, 2, or 5 mM RGD. Cells were entrapped within a fibrin clot that was encapsulated within 7.5% (A, C) or 10% (B, D) PEG hydrogels. Hydrogels contained 4 μg DNA encoding for Gaussia Luciferase. Significant difference between conditions at each time point is indicated by different letters (A, B, or C) based on ANOVA with p < 0.05. In these panels and subsequent figures, groups are statistically different if they are not marked by a common letter. For example, on day 6 of panel B, 2 and 5 mM RGD have the letter A in common, and are thus not statistically different (p > 0.05). Similarly, the 0 and 2 mM RGD conditions have the letter B in common and are not significantly different (p > 0.05). However, data for 0 and 5 mM RGD are marked with letters B and A, respectively, and are significantly different (p < 0.05). Insets compare migration of each cell type within hydrogels containing 5 mM RGD. Note that cells migrated to the outer edge of the hydrogel by day 12 for both HT-1080 and NIH/3T3 cells within 7.5% PEG containing 5 mM RGD. The day 16 data point for these conditions were removed for clarity.

