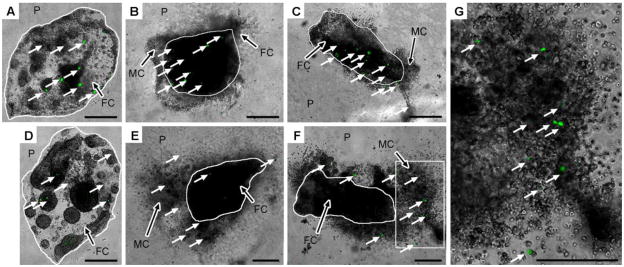
Figure 4.
Localization of transfected cells within hydrogels. Fibrin clots (FC) containing HT-1080 cells encapsulated within 10% PEG (P) containing 0, 2, or 5 mM RGD and 4 μg DNA were imaged with fluorescence microscopy at days 2 (A-C) and 5 (D-G), respectively. Migrating cells (MC) are observed at both time points in hydrogels containing RGD. White arrows denote transfected cells. The inset of (F) denoted by the white box is shown in (G). Scale bars represent 500 μm. Note the smaller scale bars for images taken at day 5 with 2 and 5 mM RGD (E, F), respectively, indicating a larger area is shown to capture cell migration. The fibrin clot dimensions may appear different as images were captured from different orientations.

