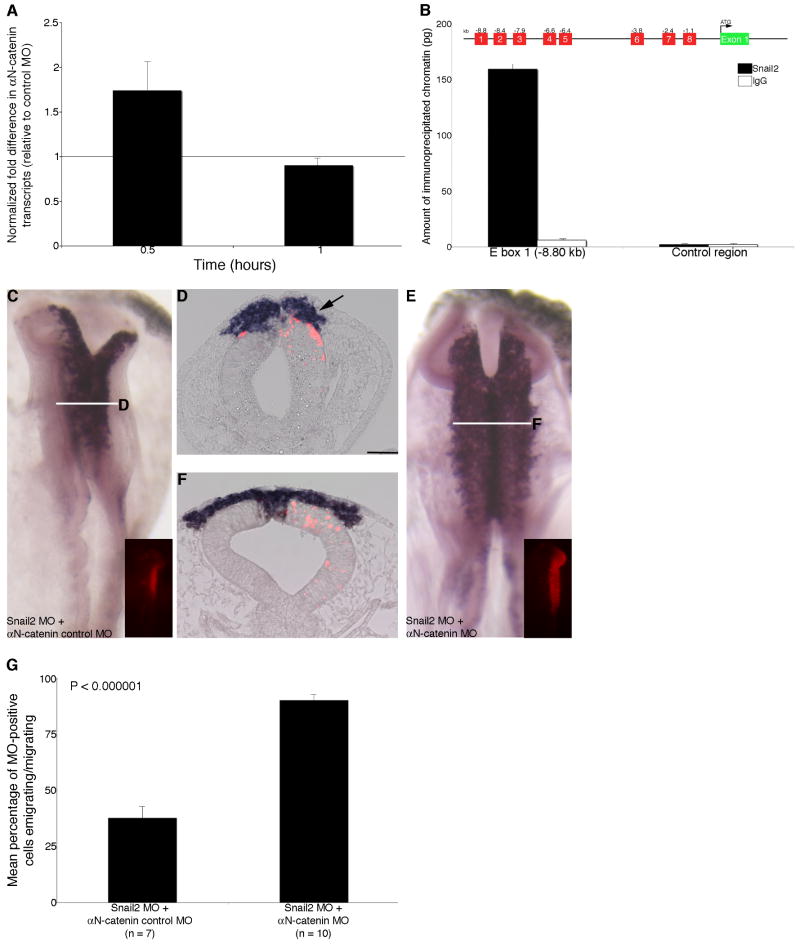
Figure 6. αN-catenin expression is regulated in the chick midbrain premigratory neural crest by Snail2.
(A) Up-regulation of αN-catenin following Snail2 depletion in a QPCR time course experiment. (B) ChIP experiments identify the association of Snail2, but not an IgG control antibody, with E box 1 in the αN-catenin regulatory region. No association of Snail2 or IgG to distal sequences lacking E box motifs in the αN-catenin 3′UTR (control) is observed, and no significant association to other E box motifs was detected for either antibody. (C,E) Whole-mount in situ hybridization for Sox10 followed by indicated transverse sections (D,F) after 8 hour treatment with Snail2 MO and αN-catenin control MO (C,D) or Snail2 MO and αN-catenin MO (E,F). Arrow in (D) points to a decrease in the size of the Sox10-positive migratory neural crest cell domain, which is restored to “wild-type” levels upon loss of both Snail2 and αN-catenin (E,F). (G) Quantification of data obtained from explanted premigratory neural crest tissue taken from embryos electroporated with Snail2 MO and αN-catenin control MO or Snail2 MO and αN-catenin MO following fixation and staining with phalloidin. Rescue of neural crest cell migration occurs upon depletion of both Snail2 and αN-catenin. Results are reported as the standard error of the mean, with statistical significance established using an unpaired Student's t test (p < 0.000001). Scale bar in (D) is 50 μm and applicable to all whole-mount and section images. MO, red; kb, kilobases; UTR, untranslated region.

