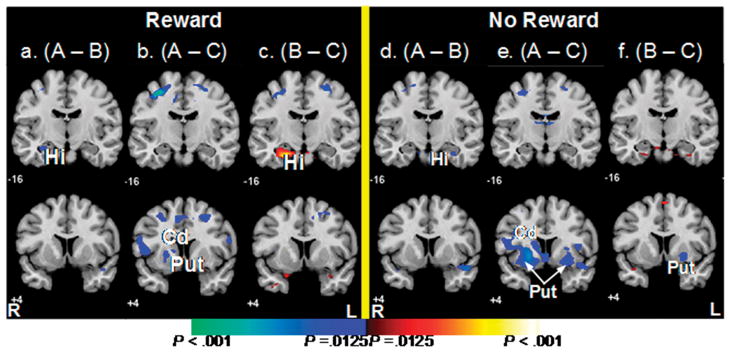
Figure 4. Average Brain Activity During the Receipt of Reward and No Reward.
These are t-maps for fMRI signal during the receipt of reward in condition A compared to control conditions B (A) and C (B), and for fMRI signal during no reward in condition A compared to conditions B (D) and C (E). Increases in signal during the control conditions are shown in blue. The hippocampus was activated during the receipt of reward (A) and no receipt of reward (D) in condition B and therefore associated with the reward experience itself during spatial learning. Also shown are t-maps for fMRI signal during the receipt of reward (C) and no reward (F) in condition B compared to C. Increases in signal during B are in red and increases during C are in Blue.
Hi, hippocampus; Cd, caudate nucleus; Put, putamen.

