Figure 2.
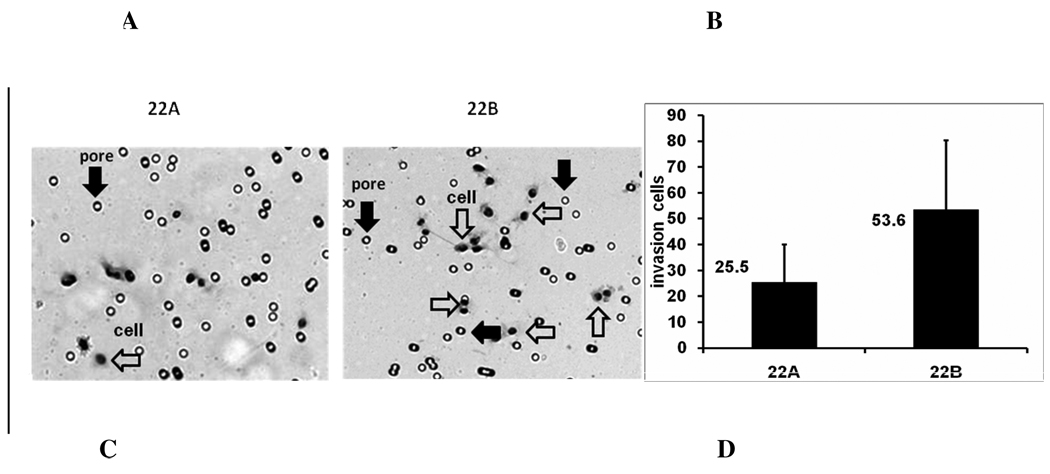
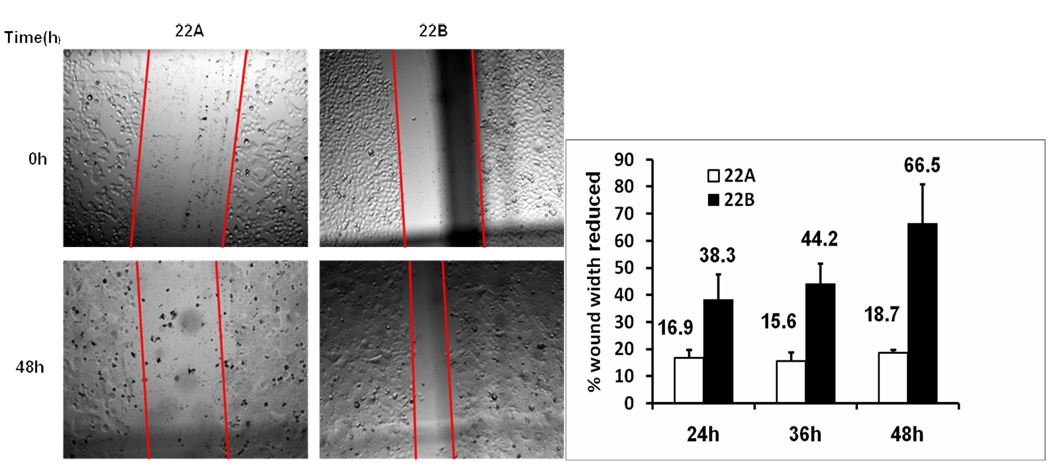
Cell invasion and migration of UM-SCC-22A and UM-SCC-22B. A. Microscopy image (×100) of invading cells in Matrigel filter invasion assay from one representative experiment. Open arrows, pore; Solid arrows, cell. In the fields shown, 9 cells are apparent in the UM-SCC-22A culture and 16 are apparent in the UM-SCC-22B culture. B. Bar graph represents invading cells number (mean ± SD) of UM-SCC22A and UM-SCC22B. from six cell invasion experiments. (*p< 0.01). C. Microscopy image (×40) of cell migration of UM-SCC-22A and UM-SCC-22B from one representative experiment. D. Bar graph represents the percentage of reduced wound width (%) compared to time 0 of UM-SCC-22A and UM-SCC-22B. from six cell migration experiments. Blank bar, UM-SCC-22A; filled bar, UM-SCC-22B.


