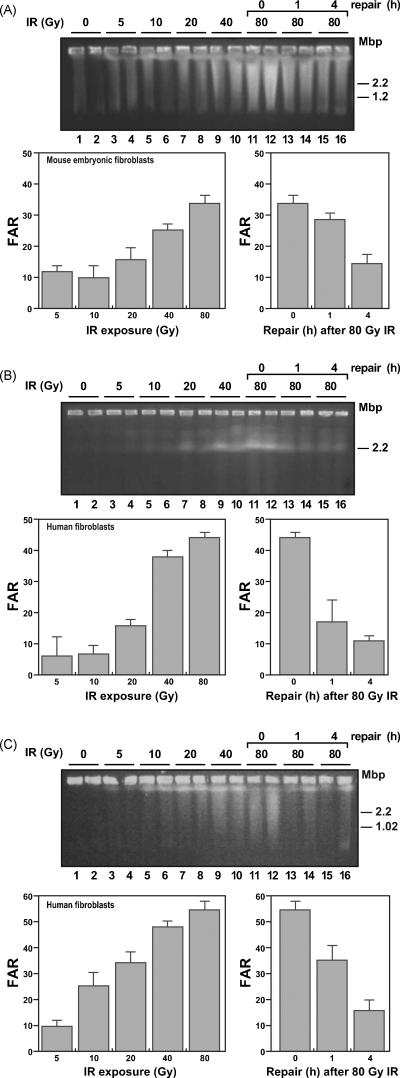
Fig. 1.
Detection of DSBs using PFGE in model cellular systems.
(A) Top, photograph of a representative agarose gel prepared using agarose plugs from MEFs treated with increasing amounts of IR; plugs were electrophoresed in a 1% agarose gel as described in Section 2. DNA was stained using Sybr Gold. Bottom, quantification of the DNA signal in panel above. The percentage of total DNA that entered the gel, or fraction of activity released x100 (FAR), was plotted. The disappearance of the 80 Gy-induced FAR signal over a 4 h period is shown separately in the plot on the right. (B) Top, representative agarose gel obtained using agarose plugs prepared from GM 166667 human fibroblasts, IR treated as in panel A. Bottom, quantification of the FAR signal from panel B. The graph on the right shows the rate of disappearance of the signal. (C) Top, representative agarose gel obtained using agarose plugs prepared from NBS1 human fibroblasts Itreated with IR as in panel A. Bottom, quantification of the FAR signals as described above. Error bars for the panels were determined from two separate samples for each experimental condition.

