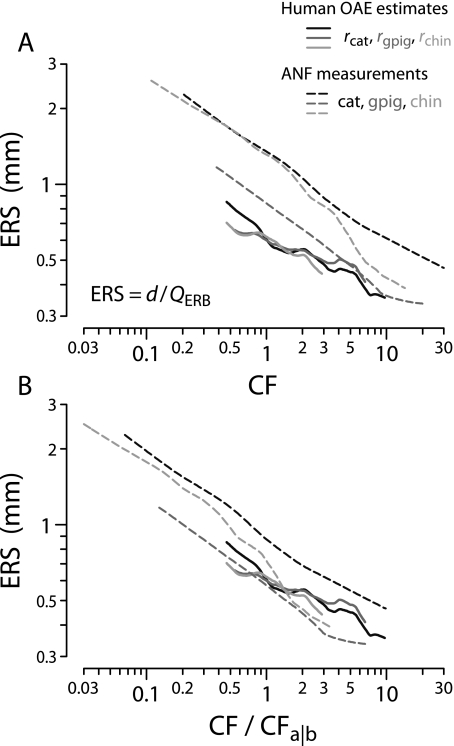
FIG. 16.
Estimates of the spatial spread of excitation (the ERS, or equivalent rectangular spread) in four species. The curves show values of ERS = d/QERB for cat, guinea pig, chinchilla, and human as computed from the QERB values in Figure 12 and space constants of the cochlear map. Panel (B) shows the ERS plotted vs CF/CFa|b.

