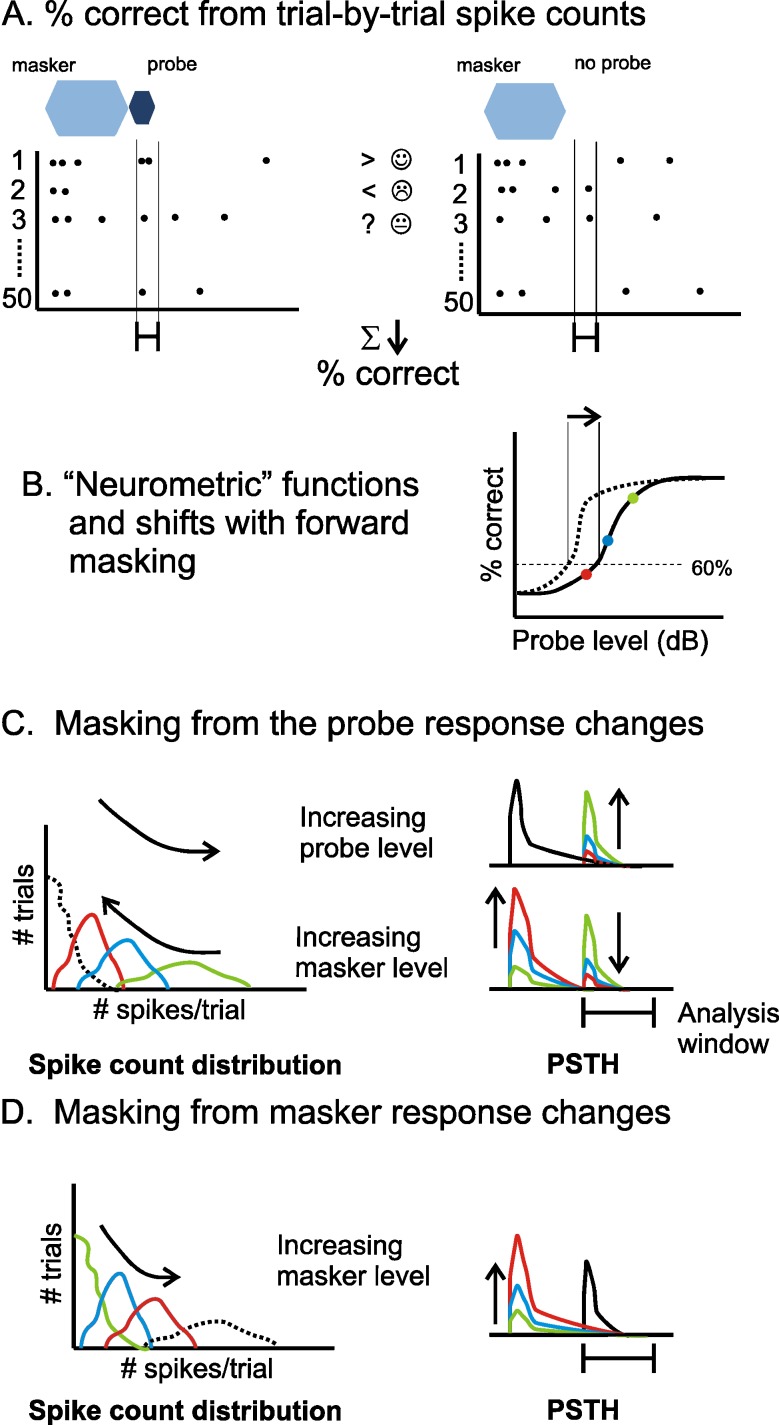
FIG. 1.
The SDT based method for analysing neural responses. A Deriving the percentage of correct detections from trial-by-trial spike count comparisons. Left panel shows a set of trials in which the probe was presented. Right panel shows a set of trials in which no probe was presented. Greater than symbol indicates a trial in which there were more spikes in the probe condition (correct detection); less than symbol indicates a trial in which there were more spikes in the no-probe condition (so an incorrect decision is made); question mark indicates a trial in which spike counts were equal, so a guess was made. B A ‘neurometric function’ describes the percentage of correct responses as a function of probe level, from which a threshold (here we use a 60% criterion—see ‘Results’) is derived. A shift in the neurometric function on addition of a masker produces a shift in the threshold (masking). C and D The SDT method described in terms of spike count distributions. C Left panel shows a set of spike count distributions from within the indicated analysis window when there is a probe (coloured lines) and when there is not (dashed line). Right panels show example PSTHs that might be associated with these distributions: different colours indicate either a change in the level of the probe or the masker. D Spike count distributions in the no-probe condition (coloured lines) can also be dependent on the masker condition (here, the dashed line shows a potential spike count distribution for the probe condition). An increase in the response to the masker within the analysis window will reduce the percentage correct.

