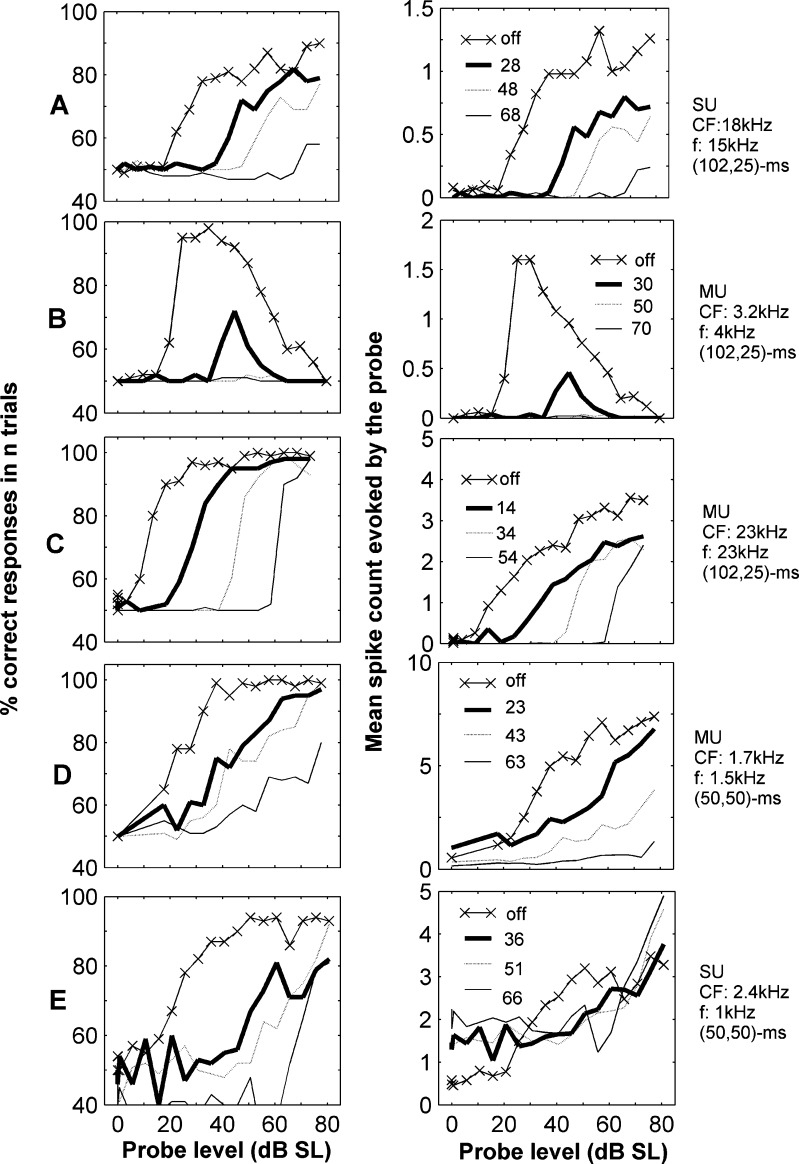
FIG. 2.
Example neurometric and rate-level functions of five cortical neurons to forward masked tones. Different rows correspond to different units. Panels in the left column illustrate the neurometric functions. Panels in the right column illustrate the corresponding mean spike count in response to the probe as a function of probe level for the same unit. Within each panel, different lines indicate different masker levels, in dB SL (re. guinea-pig audiogram), as indicated in the inset. The line marked with ‘multiplication symbol’ illustrates the responses when no masker was presented. Text on the right of the panels indicates whether the unit is a single (SU) or multi-unit (MU—see text), its characteristic frequency, the frequency of the tones and their duration in ms: (masker duration, probe duration). There was no silent gap between the masker and the probe in these examples.

