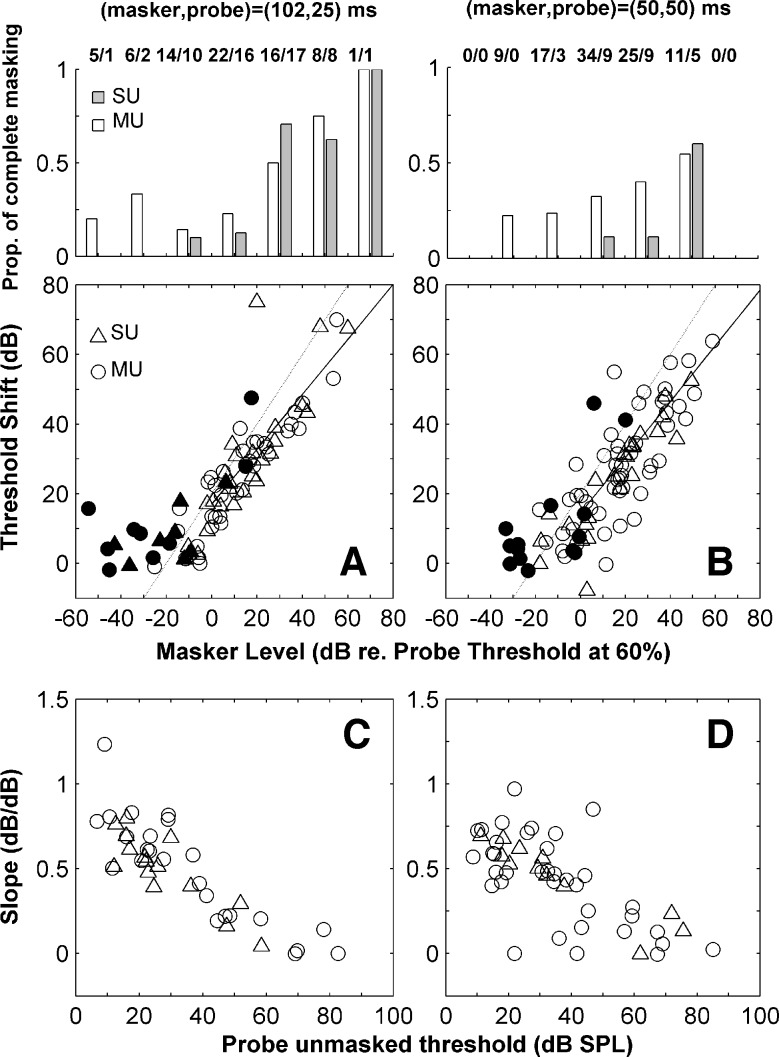
FIG. 3.
A and B. Threshold shift as a function of masker level in dB relative to the probe threshold in the condition where no masker was presented. These units had a wide range of CFs. Circles illustrate results obtained with multi-units and triangles with single units. Filled symbols illustrate results for which the presentation of the masker evoked an increase in the spike count (in the masker time window) that was less than 20% above the spontaneous spike count (within a time window of the same duration). The solid lines illustrate the slope calculated by regression across conditions in which the masker level was above the SDT threshold (>0 dB). The grey lines indicate a slope of one. The histograms on the top indicate the proportion of single (grey bars) and multi-units (white bars) for which it was not possible to obtain a threshold at a given masker level. Each column of the histogram illustrates results for masker levels falling within a range of 20 dB around the level at the center of the column. The numbers on the top indicate the total number of units tested for each level range. C and D. Slope of the growth of masking calculated for each unit, vs. unmasked detection thresholds. Left panels (A, C) refer to the condition where the masker and probe durations were 102 and 25 ms, respectively. Right panels (B, D) refer to the condition with masker and probe durations equal to 50 ms. In both cases, the masker–probe interval was 0 ms.

