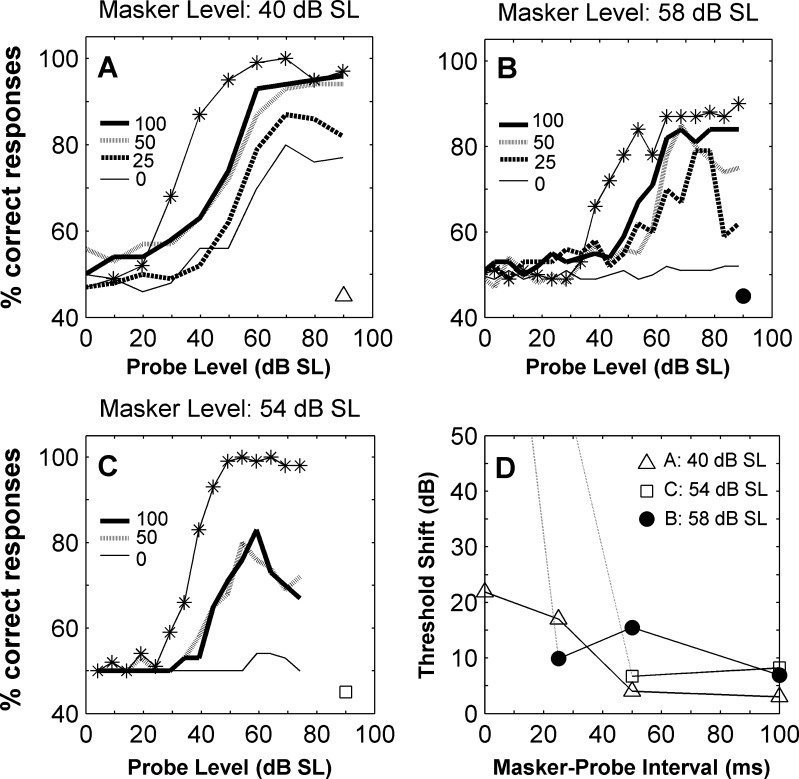
FIG. 6.
A–C Neurometric functions for three different units and for increasing masker–probe intervals. Each panel illustrates the results for a different unit. Different lines in each panel illustrate results for different masker–probe time intervals, as indicated in the insets. Also represented is the neurometric function obtained when no masker is presented (lines with asterisks). The masker level is indicated on the top of the panel. D Threshold shifts as a function of masker–probe interval. Each line illustrates the function for different units, as indicated by the inset and by the symbols on the bottom right corner of the panels A–C. Dotted lines indicate that it was not possible to estimate a threshold (and consequently a threshold shift) at short delays.

