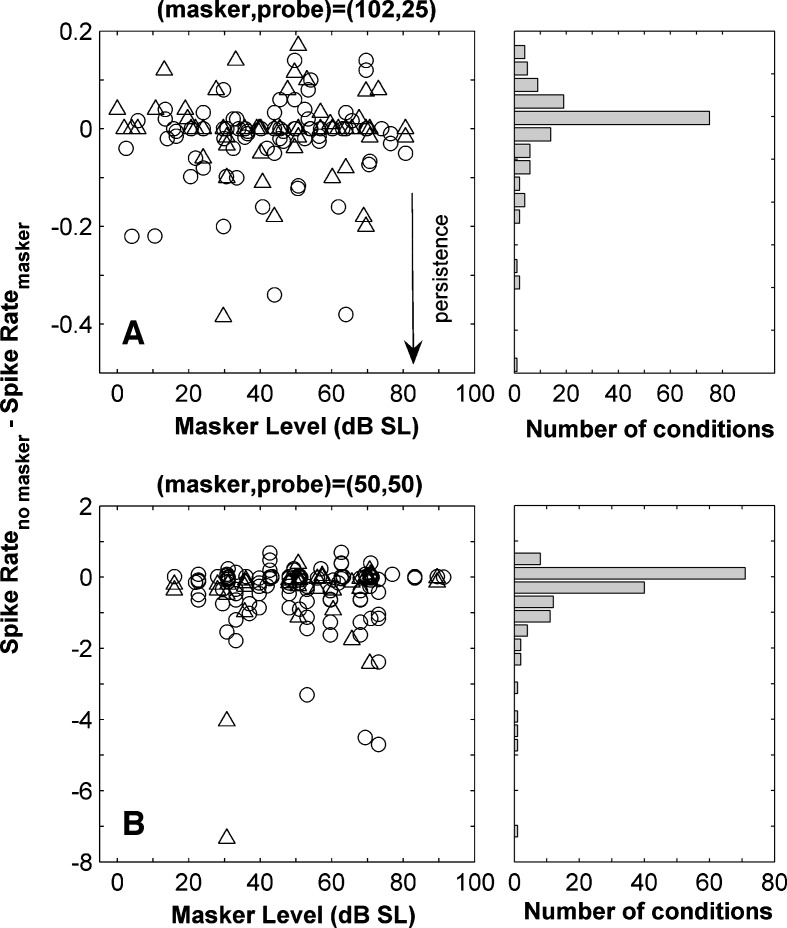
FIG. 8.
A and B Difference between the mean spike rate when no masker was presented and in the same time window after the presentation of the masker. A illustrates results for the (102,25)-ms condition and B for the (50,50)-ms condition. The probe was not presented in order to evaluate the effect of the masker alone. The histograms on the right hand side of the plots illustrate the distribution of the spike count differences. Negative values indicate persistence.

