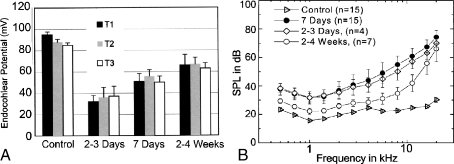
FIG. 7.
Cochlear adaptation to chronic furosemide exposure. A Mean EP values obtained from turns T1, T2, and T3 are presented as mean ± SEM (n = 5 for a 2–3 day group; n = 15 for a 1 week group; n = 7 for a 2–4 week group; n = 15 for young controls). The EP values increase with longer exposure times in all the three cochlear turns. B Mean CAP thresholds obtained from the same ears as shown in A. Thresholds of both the 2–3 day and 1 week exposed groups were elevated by about 40 dB at high frequencies and 15–20 dB at middle and low frequencies compared with those of control ear. However, thresholds in the 2–4 week group were only elevated by about 5 dB at low and middle frequencies, whereas the thresholds at high frequencies approached to those of the 2–3 day and 7 day groups.

