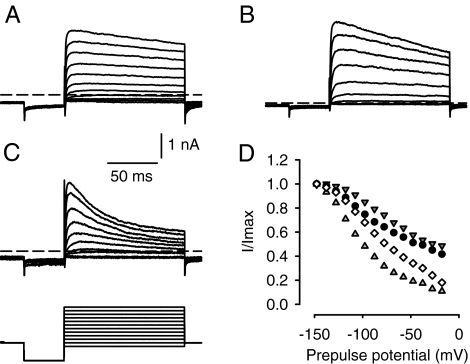
FIG. 4.
Variation in inactivation properties of outward K+ currents. Examples of outward currents in three different calyces are shown in A–C. The voltage protocol was the same for all cells and is shown in the lower panel of C. Cells were held at −78 mV, prepulsed to −128 mV, and stepped to a range of voltages between −88 and 22 mV in 10-mV increments. Dashed line indicates zero-current potential. Scale bars in A apply to B and C also. D Inactivation expressed as a fraction of peak current (I/Imax) is shown for four different cells (indicated by different symbols). Currents were measured at peak and 120 ms from the start of the test pulse to −8 mV following 40-ms prepulses to the potentials shown.

