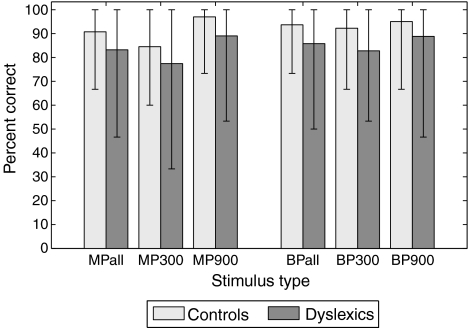
FIG. 4.
Percentage of trials containing a pitch contour in which the pitch contour was correctly identified, for the different stimulus types. For MP and BP, the overall score regardless of duration is plotted first, followed by the scores for each duration independently (300 and 900 ms). Bar height corresponds to the mean over all subjects from a given group, and error bars indicate the lowest and highest scores among all subjects from that group.

