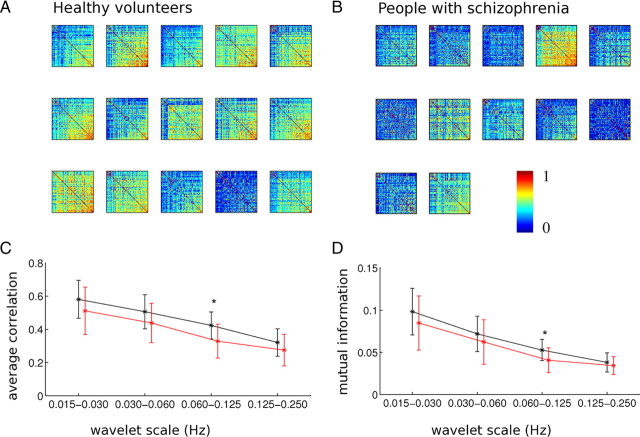
Figure 2.
Functional connectivity matrices and group differences in global connectivity. A, B, Matrices of pairwise correlations at 0.060–0.125 Hz for individual participants: healthy controls (A) and people with schizophrenia (B). Both axes represent the 72 regions used in the analysis, ordered by average strength in healthy subjects, and pixel color represents the level of correlation. C, D, Connectivity strength, R̄ (C), and average mutual information, M̄ (D), at four different wavelet scales for healthy volunteers (black) and people with schizophrenia (red). The group differences denoted by asterisks were significant at the wavelet scale 0.060–0.125 Hz for connectivity strength and mutual information (Table 2). Error bars indicate SD.

