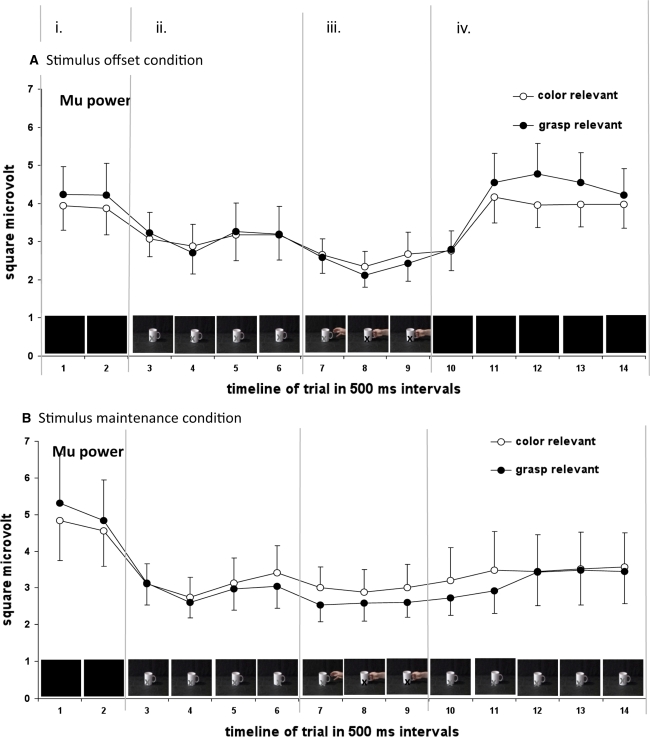
Fig. 3.
Mu power during action observation across the whole trial length, separately for the two tasks (later report grasp/later report colour) and stimulus offset/maintenance condition. Error bars denote the standard error of the mean. Mu power is computed as the mean power in the 8- to 13-Hz-frequency range over central channels (C1, C2, C3, and C4)

