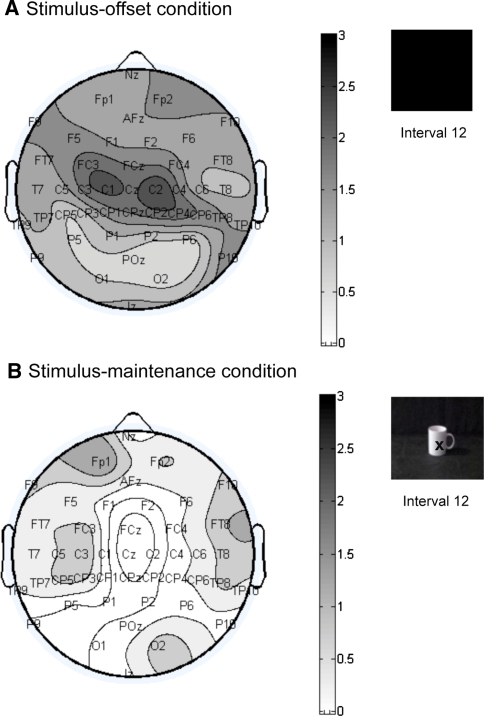
Fig. 6.
Topographical maps showing the t values of the difference in 8-to 13-Hz power between report-colour task and report-grasp task during Interval 12 (post observation of grasp), separately for stimulus-offset condition (df = 12), and stimulus-maintenance condition (df = 13). Positive t values indicate more mu power for the report-grasp task than report-colour task

