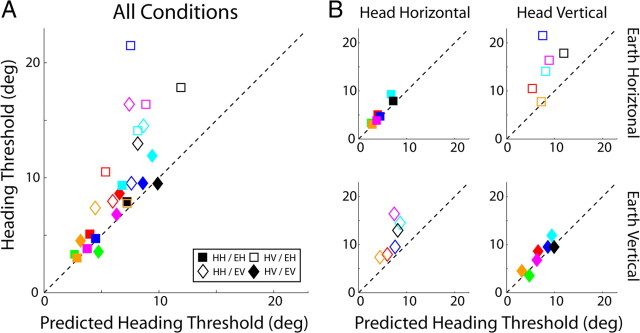
Figure 6.
Comparison of predicted and observed heading thresholds. Each subject is a different color. Filled and unfilled symbols represent upright and side-down conditions, respectively. Squares and diamonds represent earth-horizontal and earth-vertical conditions, respectively. A, Comparison across all conditions. Predicted heading thresholds are calculated from coarse direction thresholds using Equation 1. The comparison assumes that heading performance is limited by sensitivity to the orthogonal component, i.e., the difference-vector hypothesis (see Fig. 1). The dashed line has unity slope and shows where points should lie if predicted and observed thresholds matched. HH, Head horizontal; HV, head vertical. B, Same as A but plotted separately for each orientation/direction combination depicted in Figure 2.

