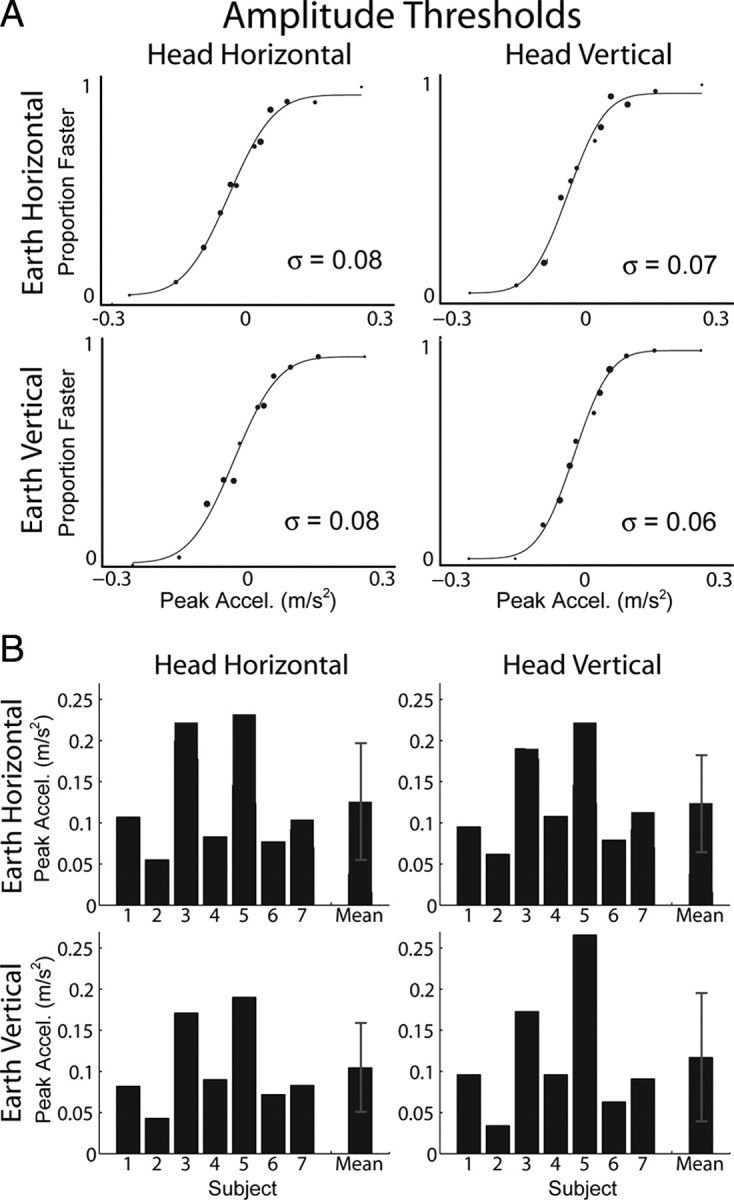
Figure 7.

Amplitude thresholds. The 2 × 2 panels in A and B show data corresponding to the orientation/direction combinations depicted in Figure 2. A, Example data from an individual subject and psychometric fits to the data. Larger data points indicate more samples at that stimulus magnitude. Threshold is the SD (σ) of the fitted Gaussian function and represents the acceleration increment (or decrement) relative to the pedestal acceleration (0.3 m/s2) that was just noticeable. B, Thresholds for all subjects and the means across subjects. Error bars represent SD.
