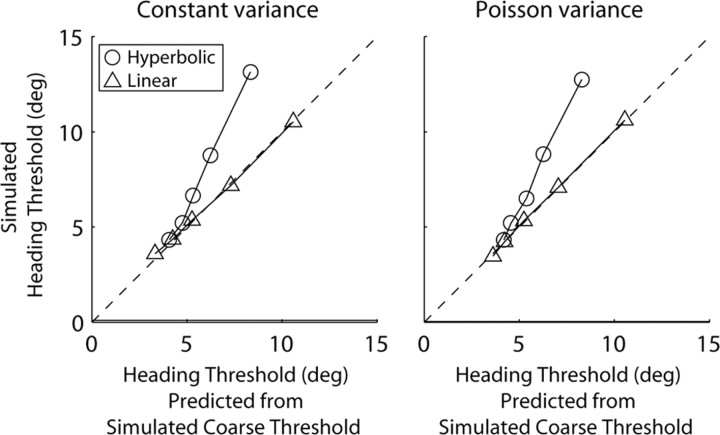
Figure 9.
Output of neurometric simulations. Each point plots output for hypothetical neuron/anti-neuron pairs with different tuning and noise properties. The dashed line has unity slope and shows where points would lie if heading thresholds matched predicted heading thresholds; predictions are calculated from coarse direction thresholds using Equation 1, similar to Figure 6. The panels on the left and right show output for neurons with constant Gaussian distributed noise and Poisson distributed noise, respectively. Triangles show output for linear amplitude response, and circles show output for amplitude response described by the hyperbolic ratio function (Eq. 3). The five points of each type in each panel show output for five different neural sensitivities, i.e., different values of s in Equation 2 (for exact values, see Table 3). High sensitivity yields low thresholds.

