
Figure 2.
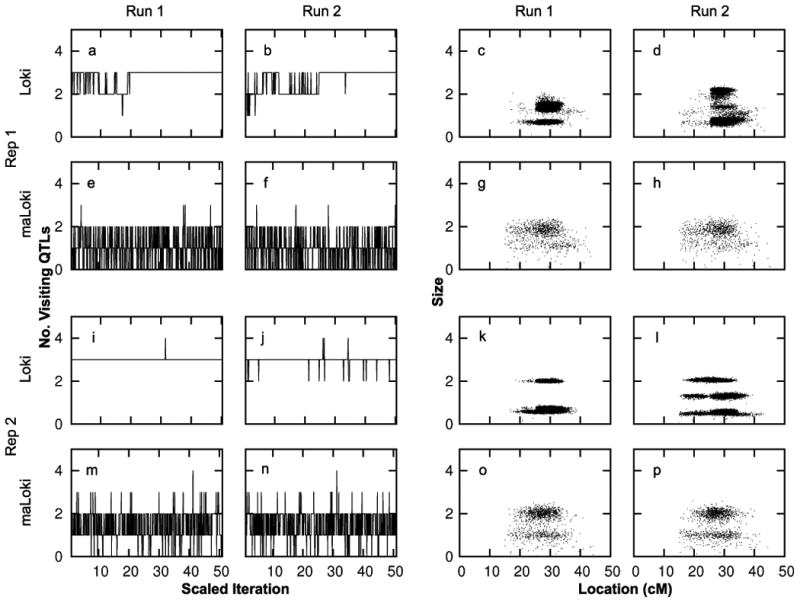
Comparison of visiting QTL parameters for paired Loki and maLoki runs on two representative simulated data replicates. Panels in left two columns show no. of visiting QTLs vs iteration/3000 for Loki and no. of visiting QTLs vs iteration/1000 for maLoki. Panels in right two columns show the size vs location (cM) of visiting QTLs