
Figure 5.
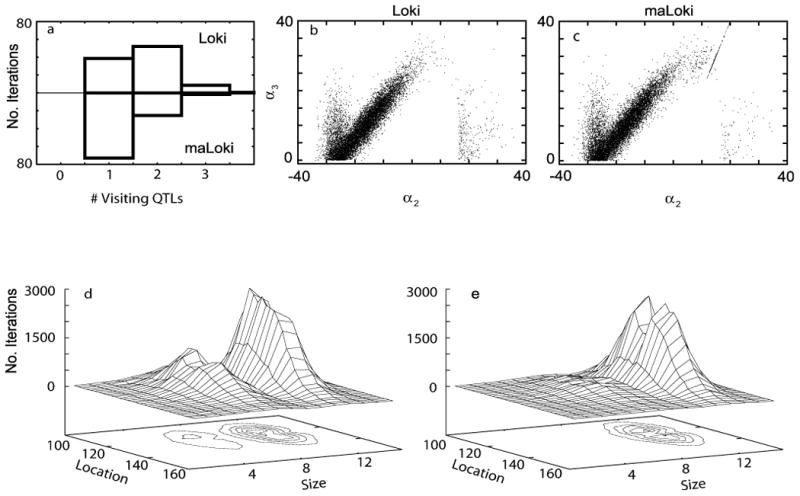
Results from analysis of HDL levels and APOC3. (a) Histogram of number of visiting QTLs when using Loki (top) and maLoki (bottom). Genotype effects of diallelic QTLs from Loki (b) and maLoki (c). These models are adjusted so that α3 ≥ 0. The line of points in (c) correspond to the additive QTLs: α3 = 2α2. Surface plots of size versus location of visiting QTLs when using Loki (d) and maLoki (e).