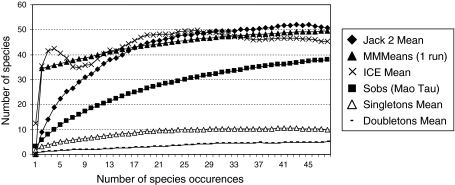
Fig. 4.
Sample-based rarefaction curves and corresponding estimators of soil and bark living oribatid mites. ICE, incidence-based coverage estimator; MMMean, asymptote of Michaelis–Menten curve estimated from the sample-based rarefaction curve; Jack 2 Mean, second-order Jackknife richness estimator. Sobs, observed species richness; Singletons, number of species present in only one samples; Doubletons, number of species present in exactly two samples

