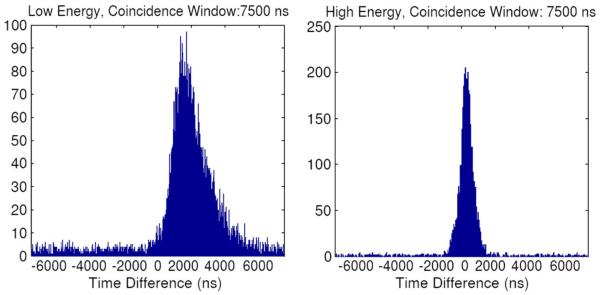
Fig. 12.
Histograms of time differences collected from all detector strips at two different energy windows using an Am-241 source. Using the ADC values, the events (17 keV x-ray) were separated from the high-energy (60 keV) photon emission of the source. A separate timing histogram was created for each group.

