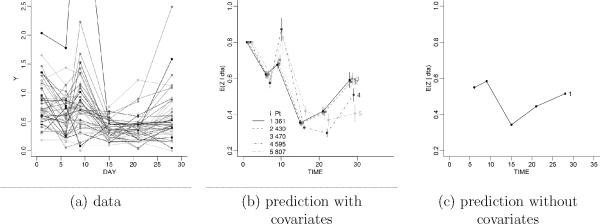
Figure 1.
Panel (a) shows the data. The figure plots monocyte count versus day of the first cycle chemotherapy for n = 47 patients. Panel (b) shows prediction for arranged by from lowest (“1”) to highest (“5”) level of carboplatinum. Panel (c) shows for comparison prediction without covariate-dependent clustering. By construction prediction in (c) is identical for all patients.

