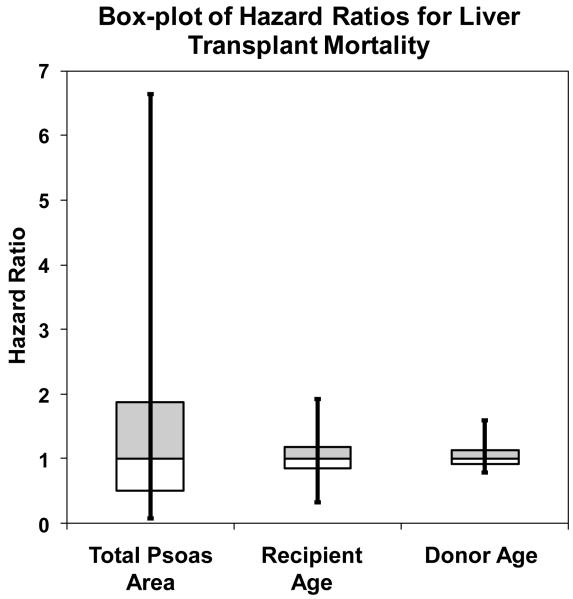
Figure 6.
Box-whisker plot of the adjusted hazard ratio (HR) for total psoas area (TPA), recipient age, and donor age. The box includes the central 50% of the data, while the whiskers include the central 90%. The distribution is covariate-adjusted as a HR=1 is assigned for every adjustment covariate. Differences in TPA values across the study population produce very large differences in post-transplant mortality risk, even after factoring out the impact of the other covariates. When we compare TPA to other covariates (recipient and donor age), we note that TPA is associated with a more profound variation in the HR for mortality.

