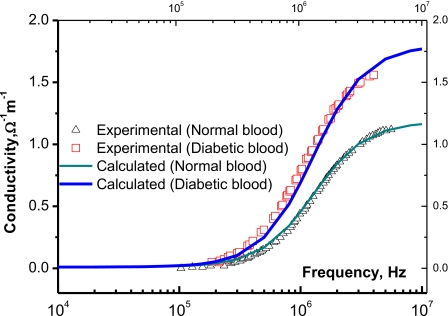
Figure 1.
The electrical conductivity of normal and diabetic blood as a function of the applied frequency. Solid lines represent calculated values after Eq. 19 and triangles and squares are experimental data for normal and diabetic bloods, respectively.

