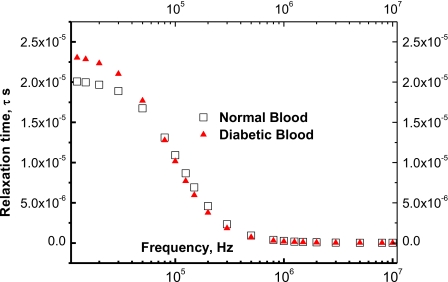
Figure 5.
The relaxation time, τ, of normal and diabetic bloods as a function of frequency. The calculated values after Eq. 30 coincide with the experimental values (squares and triangles are experimental data for normal and diabetic bloods, respectively); but these calculated values are omitted for more clarity.

