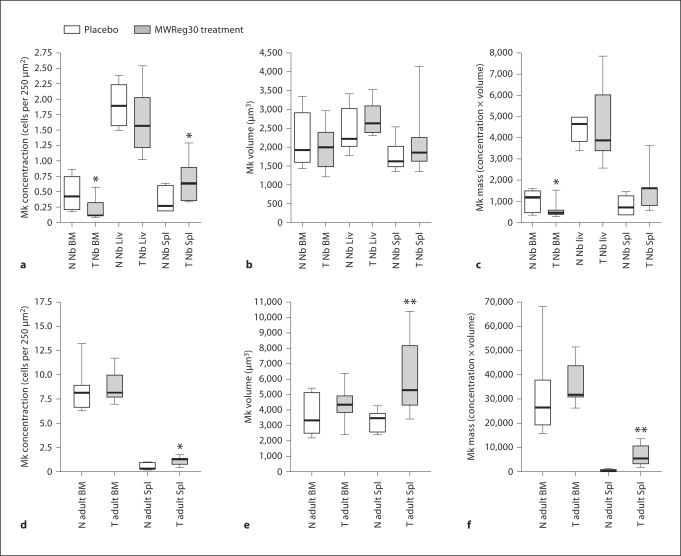
Fig. 3.
Box-plots displaying the megakaryocyte (Mk) concentration, size and mass in the bone marrow (BM), liver (Liv) and spleen (Spl) of neonates (a–c), and in the bone marrow and spleen of adult mice (d–f). The box-plot margins represent the 25th–75th percentiles, the whiskers represent the ranges, and the line, the median. N = Normal; T = thrombocytopenic. ∗ p < 0.05 and ∗∗ p < 0.01 versus age-matched controls.

