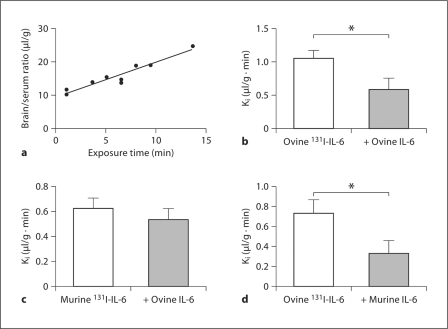
Fig. 3.
Line graph showing a significant linear relation between brain/serum ratios and exposure time for ovine 131I-IL-6 (a) (each point represents 1 subject) and histograms showing that 3 μg/mouse unlabeled ovine IL-6 significantly inhibited the permeability of ovine 131I-IL-6 (b), that 1 μg/mouse unlabeled ovine IL-6 was unable to inhibit the permeability of murine 131I-IL-6 (c) and that 1 μg/mouse of unlabeled murine IL-6 was able to inhibit the transport of ovine 131I-IL-6 across the BBB (d), indicating higher affinity for murine than ovine cytokine. Error bars are SEM. ∗ p < 0.05.

