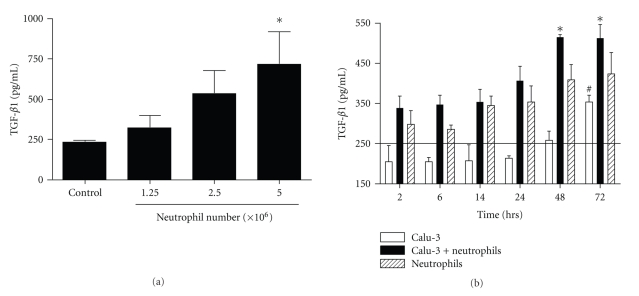
Figure 3.
TGF-β1 production in epithelial/neutrophil cocultures. (a) TGF-β1 production was measured by ELISA in supernatants of Calu-3 cells incubated for 48 hrs with increasing numbers of neutrophils (1.25 × 10⁶ to 5 × 10⁶ cells). (b) Kinetics (from 2 to 72 hrs) of TGF-β1 production by Calu-3 cells alone (open bars), neutrophils alone (5 × 10⁶ cells, stripped bars) or epithelial cell/neutrophil cocultures (5 × 10⁶ neutrophils, solid bars). The horizontal bar represents TGF-β1 concentration in complete medium, containing fetal calf serum (201 ± 40 pg/ml, mean ± SD, n = 3). Data are means ± SEM (n = 4 independent experiments, both for a and b). (a) *P ≤ .05 as compared with control; (b) *P ≤ .05 as compared with Calu-3 alone, #P ≤ .05 as compared with Calu-3 at 2 hrs.

