
Figure 2.
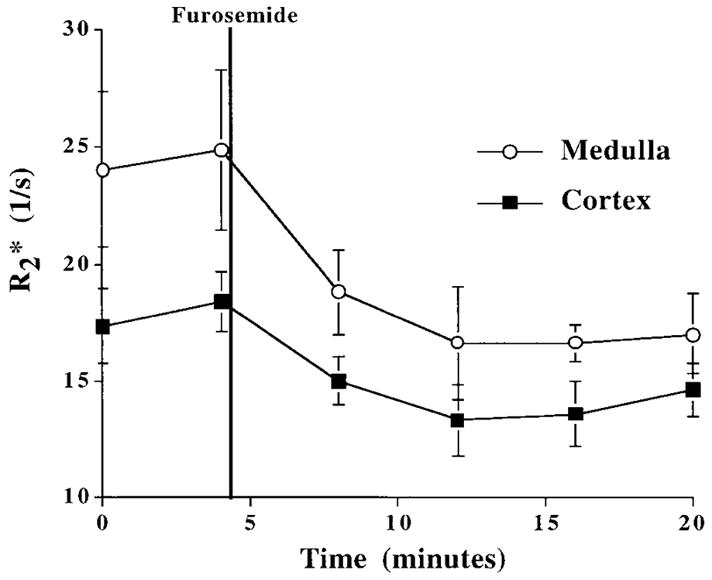
Changes in in the medulla and cortex after injection of furosemide. The first two points for both curves are baseline (pre-injection). Both medullary and cortical drop after the injection of furosemide and stay relatively constant over the 20 minute period of observation. Error bars represent standard deviation in the individual ROI measurements.