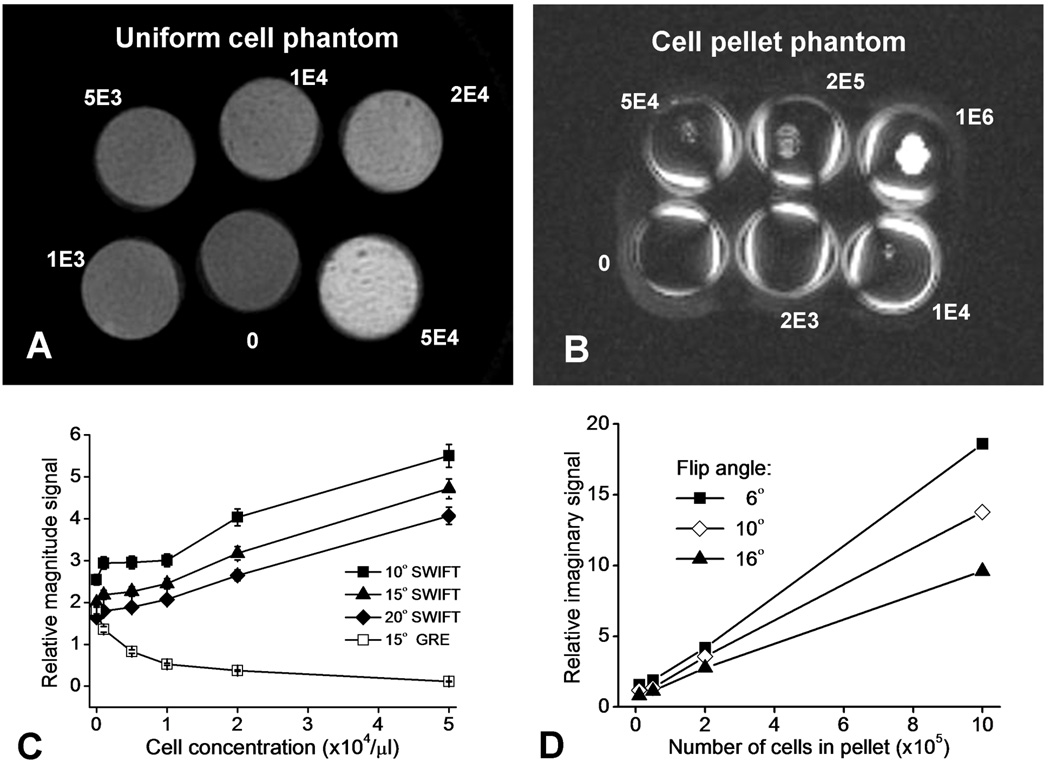
Figure 2.
Results from the cell phantom studies. The SWIFT magnitude mode image of the uniformly distributed cell phantom (A) and the maximal intensity projection of the phase-corrected SWIFT imaginary mode image of the cell pellet phantom (B) are shown. The signal magnitude as a function of cell concentration in the uniform cell phantom is plotted, for GRE and SWIFT acquisitions using different flip angles (C). The SWIFT imaginary mode signal (root of the summation of the square, RSOS) as a function of number of cells in the cell pellet phantom is plotted, for SWIFT acquisitions using different flip angles (D). The error bars in C represent standard deviation of the measured signal intensity in 30 ROIs.

