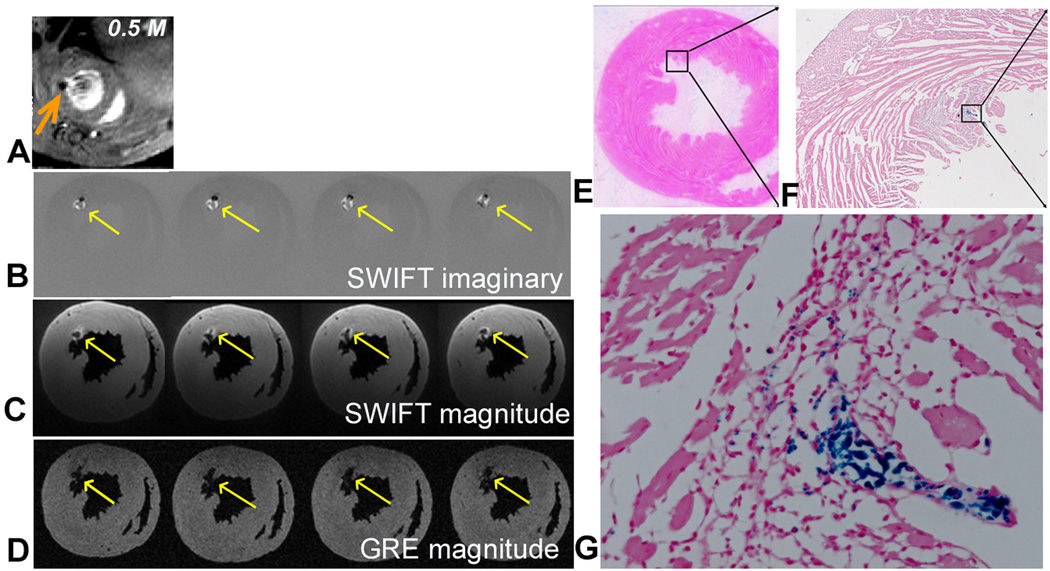
Figure 4.
In vivo GRE image (A), ex vivo SWIFT imaginary (B), magnitude (C), and ex vivo GRE magnitude (D) images obtained from a heart receiving 0.5M labeled stem cells. Arrows indicate location of cells. E-G: Prussian blue staining of the heart sections at the corresponding level of MR images. Magnified views of the box in E and F are presented in F and G, respectively.

