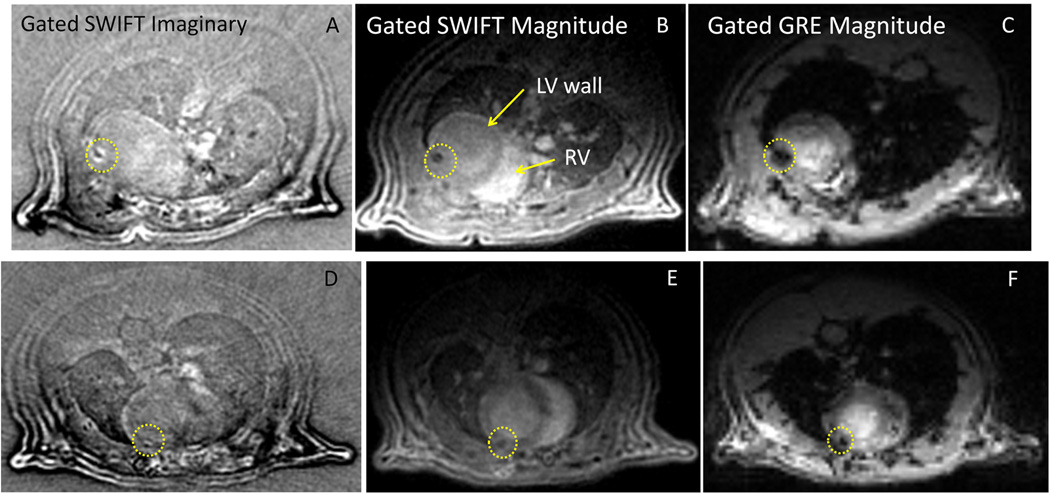
Figure 5.
ECG-gated in vivo SWIFT and GRE images of two rats receiving 5 million (A-C) and 2 million (D-F) SPIO-labeled stem cells. SPIO-associated signals are marked by a yellow circle on the SWIFT imaginary (A, D) and magnitude images (B, E) and GRE magnitude images (C, F). While SWIFT images were acquired only during end-of-diastole (see Methods), GRE images were acquired over the entire cardiac cycle in order to reduce the scanning time. Therefore, panels C and F are not diastolic images, but they represent similar anatomical location.

