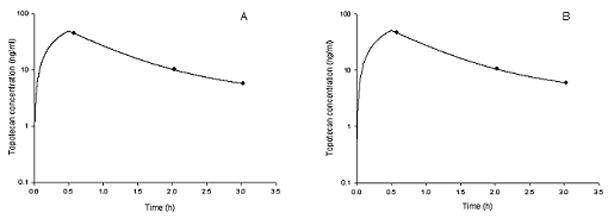
Figure 4.

Topotecan lactone concentrations vs. time profile for a representative patient (A). Topotecan lactone in whole blood concentration (ng/ml) vs. time profile obtained from plasma samples (B). Concentration (ng/ml) vs. time profile was obtained from whole blood samples after transforming the concentrations by the relationship between plasma and whole blood concentrations in the same patient. The line represents the best-fit line from the model fit to the patient concentration data.
