FIGURE 3.

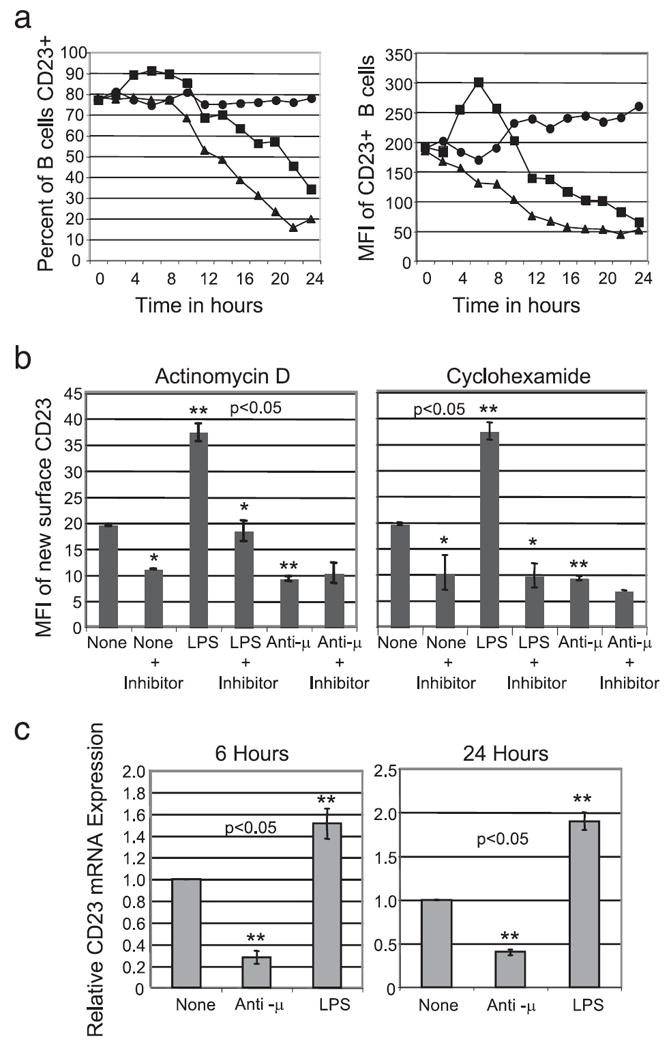
LPS induces transcriptional activation of CD23 expression. a, C57BL/6 splenic B cell surface expression of CD23 was determined by flow cytometry following stimulation in vitro for the times indicated; untreated (●), LPS (■), or anti- μ (▲). b, New surface CD23 was determined by flow cytometry 6 h after in vitro treatment in the presence and absence of 12.5 μM actinomycin-D (left) or 100 ng/ml cyclohexamide (right). c, Relative cellular CD23 mRNA expression was quantified by real time PCR 6 and 24 h following treatment of the indicated stimuli. Statistical significance was determined using the Wilcoxon signed-rank test. (*, statistically significant change in CD23 expression compared with nontreated or treated cells without the inhibitor; **, statistically significant change in CD23 expression compared with the untreated control. p < 0.05).
